# Mark Levels
Molecule uses a concept called **Mark Level** (also called **curve\_source** or **quality** in some places) to determine the priority of marks and volatilities used to value a trade.
#### Primary Function
The primary function of mark levels are to allow Molecule to distinguish between market data for identical instruments, but of differing quality. For example, an estimate provided by a user is not as official as the published settlement price for the day. Molecule's valuation engine always picks the best mark level available for a given as\_of date, when it computes valuation rows.
#### Levels
There are 6 mark levels available. In order of maturity:
* **User Provided (**`user`**)**: generally uploads from the screen
* **Settles (**`vendor`**)**: market prices provided by Molecule-built feeds
* **Prelims (**`prelim`**)**: preliminary market prices provided by Molecule-built feeds. These typically start arriving mid-day.
* **Substituted Prelims (**`prelim_copy`**):** preliminary market prices provided by Molecule-built feeds that are commonly used to mark other symbols intra-day.
* **User Provided Estimate (** `user_estimate`**):** user-provided market prices that will be overridden by automated feeds
* **Copied from Prior Day (** `copy`**):** automated copies from a prior day, to kick off option greek calculations among other things.
Note that the names in `code` are different from the colloquial names in some cases. When seen in raw data from Molecule, or via the API, mark levels are shown in the `curve_source` column, with one of these values.
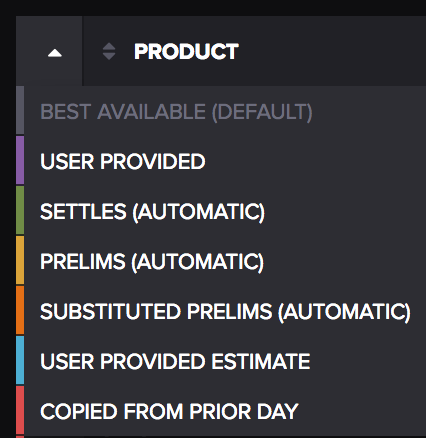
#### Colors
Mark levels, when shown on the Market Data screens, have colors indicating the most mature mark in a given curve. To see the colors, go to Market Data/Curves, and click on the white triangle in the top-left corner. Molecule will display the spectrum below.
On the Market Data screens, choosing a mark level in this menu will filter the displayed market data to that mark level.
#### Corner Cases
Strike interpolation and some other scenarios make the best-available mark level concept more tricky. In general, if two marks are used (i.e., a mark with a $35 strike and another at $40 to interpolate a $37.50 strike) both marks must be at the same level.
#### Using Mark Levels
You can directly and indirectly interact with mark levels in Molecule. Options include:
* anything uploaded via spreadsheet will be marked as `user`.
* anything posted via the API, unless otherwise specified, will be marked as `user`.
* a spreadsheet uploaded that has the word `estimate` in its filename will be marked as `user_estimate`.