Understanding Report and Valuation Logic
Last updated: July 1, 2026
When you're trying to understand how a figure was derived — a P&L number, an MTM change, a position, a value in a report — the answer depends on which kind of number it is. Standard valuation and metric fields have published formulas you can look up yourself; figures in a custom report Molecule built for your firm run on bespoke logic you can't see. This article helps you tell the two apart, points you to the documented formulas for standard fields, and sets honest expectations for custom-report figures.
First, which kind of number is it?
Before anything else, work out which of two categories your number falls into — the path is different for each.
Standard outputs. Figures on the Valuations screen, in the standard valuation and metrics fields, and in standard extracts — things like MTM (mark-to-market: the current market value of a position), MTM change, realized and unrealized P&L, position, and decay. These have documented formulas you can look up yourself in the help center.
Custom report figures. Numbers in a bespoke report Molecule built specifically for your firm — often a named report like a "Gas Tracker," a reconciliation report, or a credit report. These run on custom logic written and maintained by Molecule that isn't visible to customers, so you can't look up the formula the same way.
A quick heuristic to tell them apart: if the field appears on Molecule's standard Valuations screen or in a standard extract and it's described in the help center, treat it as standard — look up the formula. If it's a report someone at Molecule built specifically for your firm and you can't find its fields in the standard docs, treat it as custom — ask support.
Standard fields: look up the formula
For standard fields, the formulas are published — so rather than repeat them here (where they could drift out of date), here's where each one lives:
"Metrics Molecule Calculates" — the calculated metrics and their formulas, including how MTM and MTM change are computed and the business-day rule for the prior mark.
"Valuation Outputs" — the definition of each valuation field: realized vs unrealized, the value and quantity fields, and the decay fields.
"Pricing Formulas" — the building blocks for formula-priced trades (best(), spreads, alpha, product references).
"Mark Levels" — which mark fed a valuation (the mark source ), which is often the real question behind "why is this number what it is."
"Trades: Calculating Position and P&L" — how a position is derived, and why a trade is not the same as a position .
"Decay" — how decayed quantity and value behave across the delivery period.
To orient you, one plain-language example of the most-asked derivation: MTM change is, roughly, the change in a position's mark since the prior business day, multiplied by the position quantity. That's the intuition — for the exact, authoritative formula (and any current notes), read "Metrics Molecule Calculates" rather than relying on this one-liner.
The inline MTM-change description matches Molecule's published formula — MtM Change = (market price − prior market price) × quantity — and the prior-business-day (CME-calendar weekday) rule. Confirmed against the molecule.io blog and the internal KB. No change needed.]
A standard field on the Valuations screen.
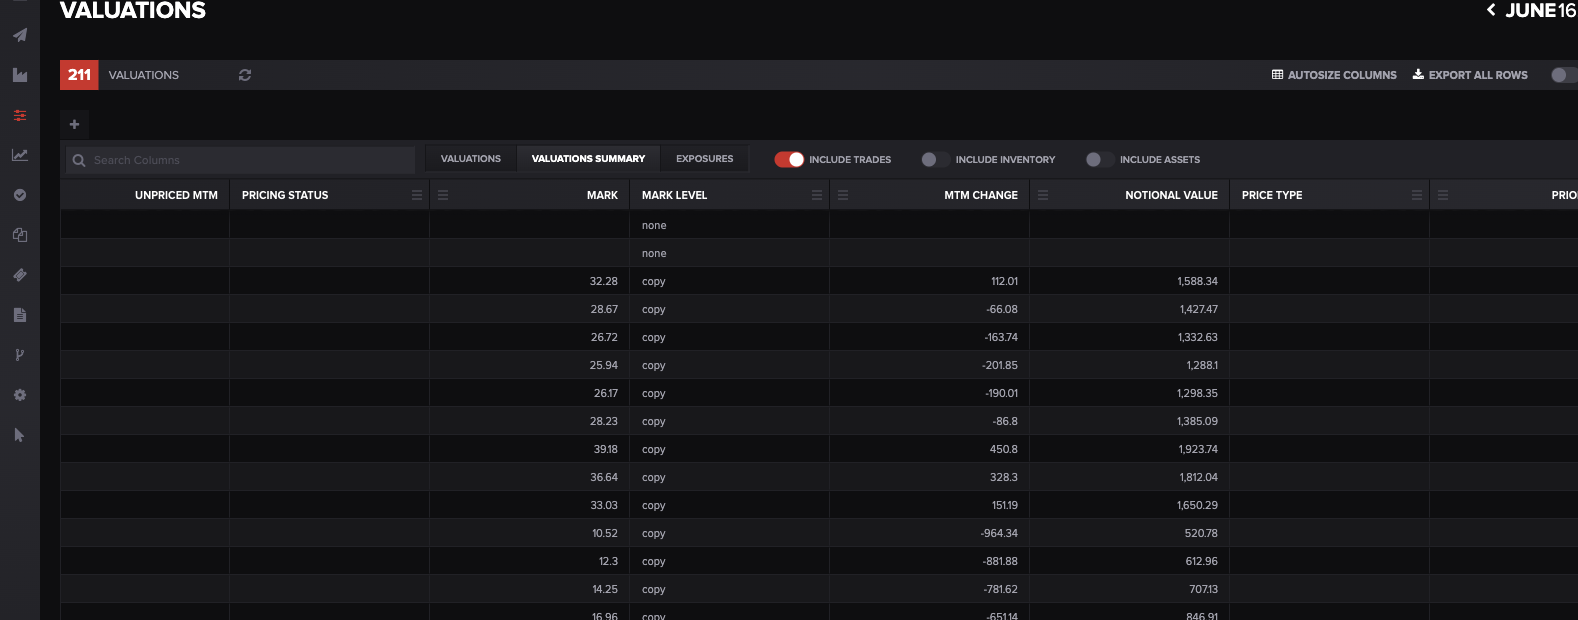
Standard valuation fields like MARK, MTM CHANGE, and NOTIONAL VALUE have published formulas you can look up in the help center. Alt text: The Molecule Valuations screen showing standard MARK and MTM CHANGE columns.
Custom report figures: ask support
A custom report is different. Its logic — the calculations, filters, and groupings behind each figure — is written and maintained by Molecule and isn't visible to you. You can't open the report and read its formula the way you can with a standard documented field, and there's no automatic, customer-facing description of how each custom figure is derived.
So if you need to understand how a specific number in a custom report is calculated, ask support — and make it answerable in one round-trip by naming:
the exact report (as it appears in your reports list),
the exact figure or column you're asking about, and
what you're trying to reconcile it to (the number you expected, and where that came from).
Support can help explain the intent and logic behind a given figure. One honest expectation, though: custom reports aren't covered by the standard support SLAs, so a detailed explanation of bespoke report logic may take longer than a standard support answer. Plan accordingly — and if you need a figure explained before a deadline, ask early.
A named custom report in the reports list.
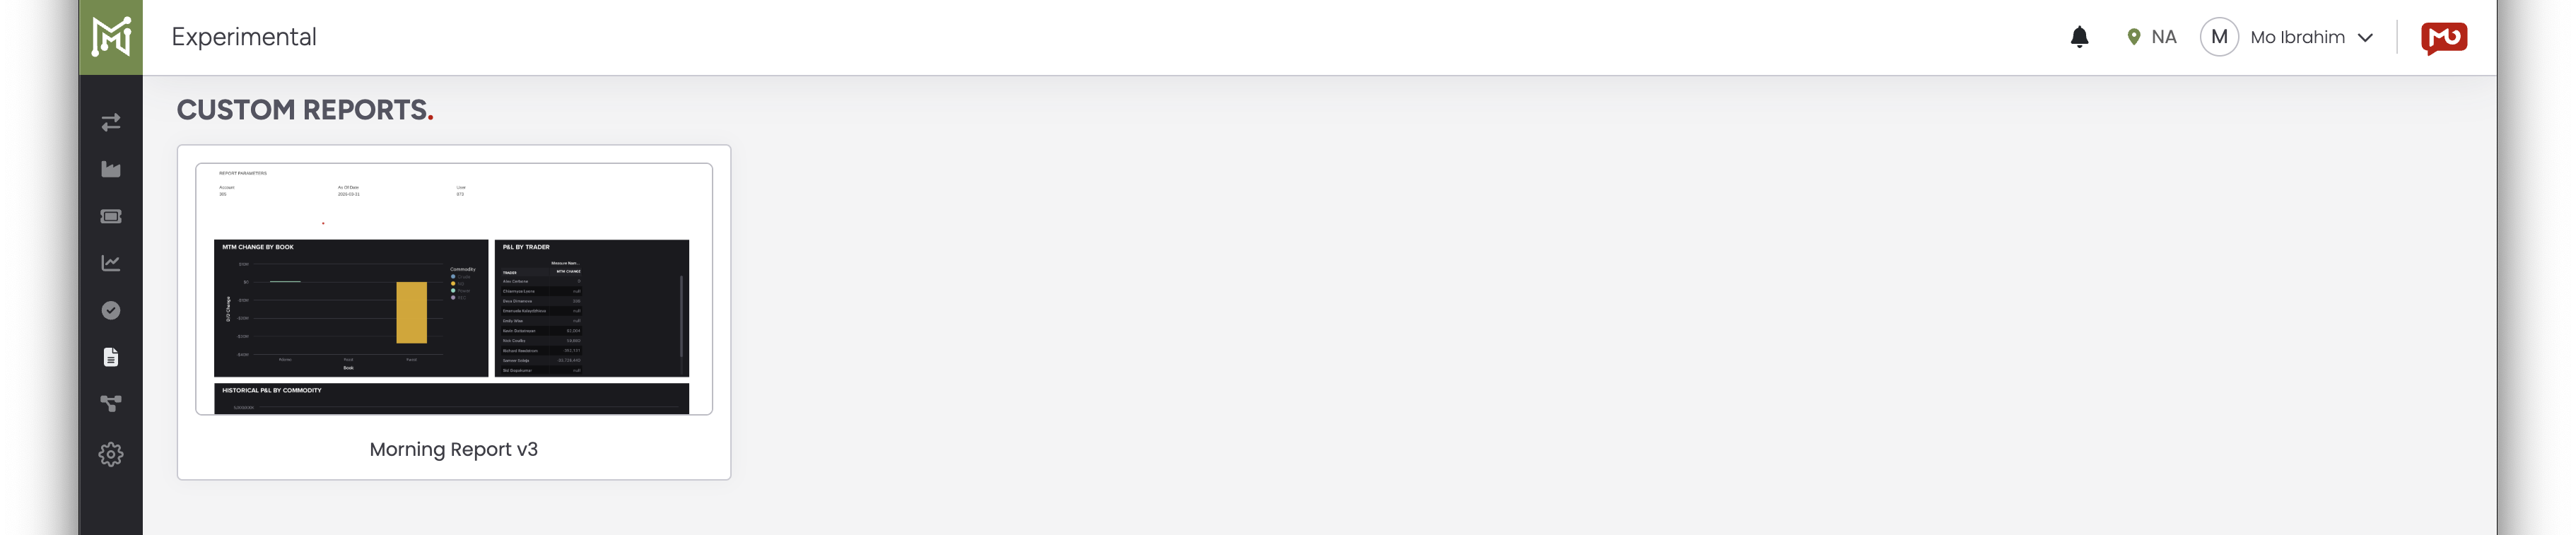
A custom report like this — here, a report named "Morning Report v3" — runs on Molecule-maintained logic you can't view; ask support to explain a specific figure. Alt text: The Molecule Custom Reports screen showing a named custom report with a dashboard thumbnail.
Often it's the inputs, not the formula
Here's the reframe that resolves a lot of these questions before they ever need a formula: often the puzzle isn't the calculation — it's the inputs. Most of these you can check yourself:
Which mark fed it? A stale or copied mark produces a different number than a fresh one. The mark source tells you which mark was used — see "Mark Levels" and the P&L/valuation diagnosis article.
Realized vs unrealized. Is the figure the portion you think it is? A number can look "wrong" only because you're comparing realized to unrealized, or the reverse — see "Valuation Outputs."
Position vs trade. A position nets multiple trades together, so a position figure won't tie back to any single trade — see "Trades: Calculating Position and P&L."
As-of and business day. A "change" is measured against the prior business day , not the previous calendar day — so a Monday change spans the weekend.
Confirm the inputs first. If they're all right and the number still doesn't make sense, then it's a formula/logic question: for a standard field, look up the article; for a custom report, ask support.
FAQ
How is MTM change calculated?
In plain terms, it's the change in a position's mark since the prior business day, times the position quantity. For the exact formula and the business-day rule, see "Metrics Molecule Calculates."
Where can I see the formula behind my custom report?
You can't view it yourself — custom report logic is built and maintained by Molecule and isn't exposed in the report. If you need to understand a specific figure, ask support, naming the report, the exact column, and what you're reconciling it to; they can explain the intent and logic.
Why doesn't my position tie to a single trade?
Because a position nets multiple trades into one figure — it isn't a per-trade number. "Trades: Calculating Position and P&L" walks through how a position is derived and why a trade and a position aren't the same thing.
Why is realized P&L different from what I expected?
Two common reasons: you may be looking at the unrealized portion instead of the realized one (or the reverse) — check the definitions in "Valuation Outputs" — or the underlying mark may not be the one you assumed, which "Mark Levels" will show.
How long does it take to get a custom report figure explained?
There's no fixed turnaround — custom reports aren't covered by the standard support SLAs, so a detailed logic explanation can take longer than a standard answer. Plan ahead, and ask early if you need it before a deadline.
Related articles
Editor: hyperlink each of these to its help.molecule.io article before publishing.
If you're still stuck after the checklist above, contact support@molecule.io with the details listed in "If none of these explain it."