How to Pivot and Group on the Valuations Screen
Once you've created a view, you can group and aggregate it for collapsible and expandable trade-level detail.
First, go to the VALUATIONS screen from the main menu.
Grouping on a Detailed View
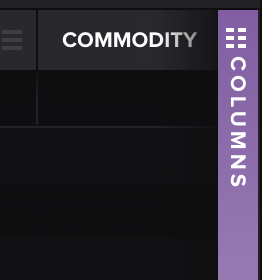
Once you're under your desired view, click on the purple column picker on the right-hand side of the screen.
Then, you can choose the columns you'd like to include in your view.
TIP: You can scroll or use our search bar for quicker access.
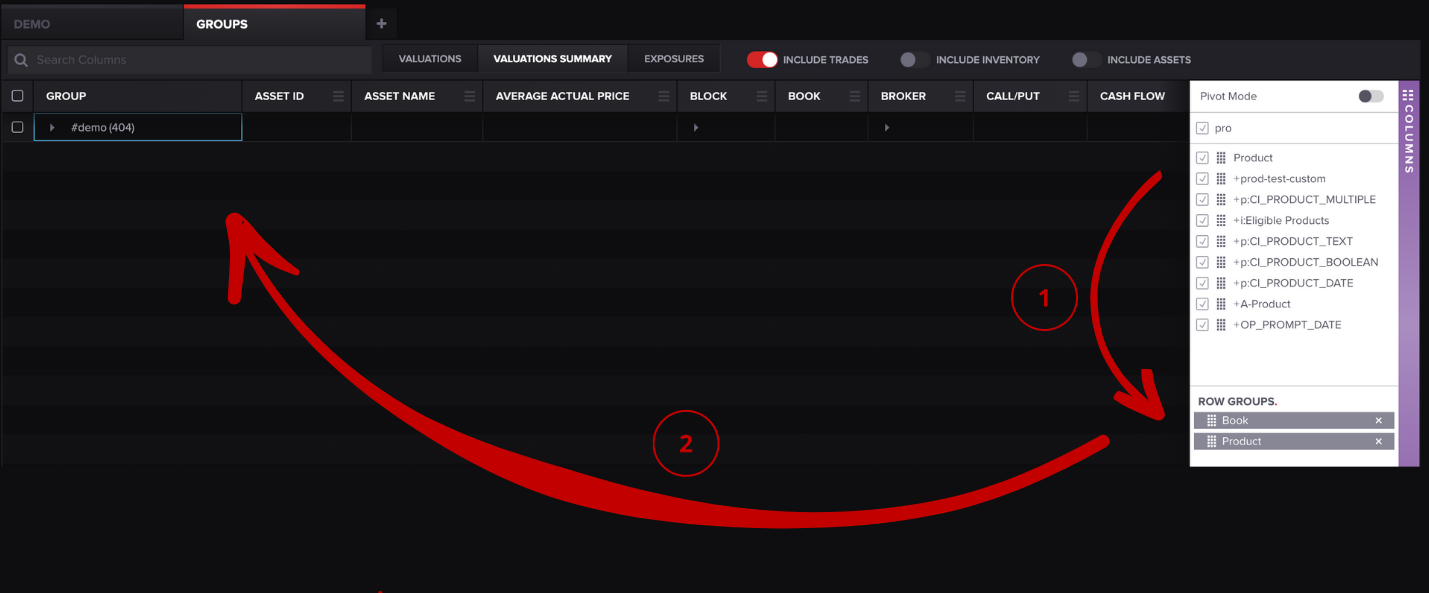
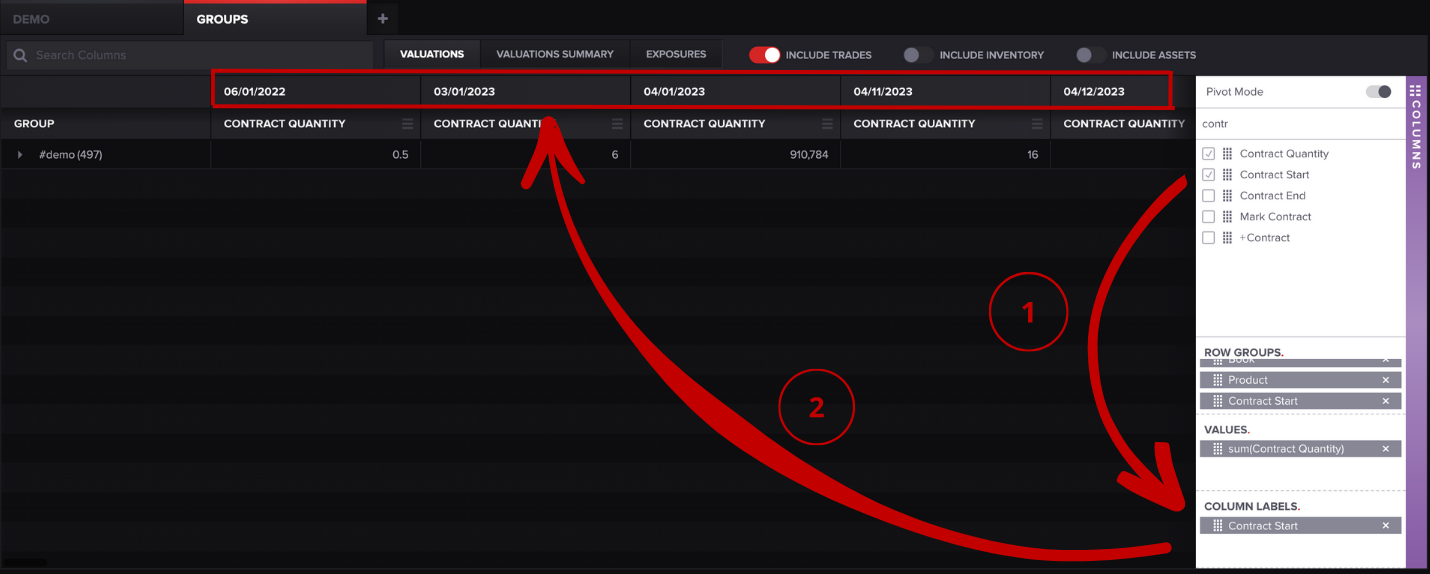
Drag columns by holding down the grid symbol to the left of the name and moving them to the ROW GROUPS section. Once you do, a field should populate under your view tab, as shown above.
Once you've added columns under ROW GROUPS, you can add columns under the VALUES section.
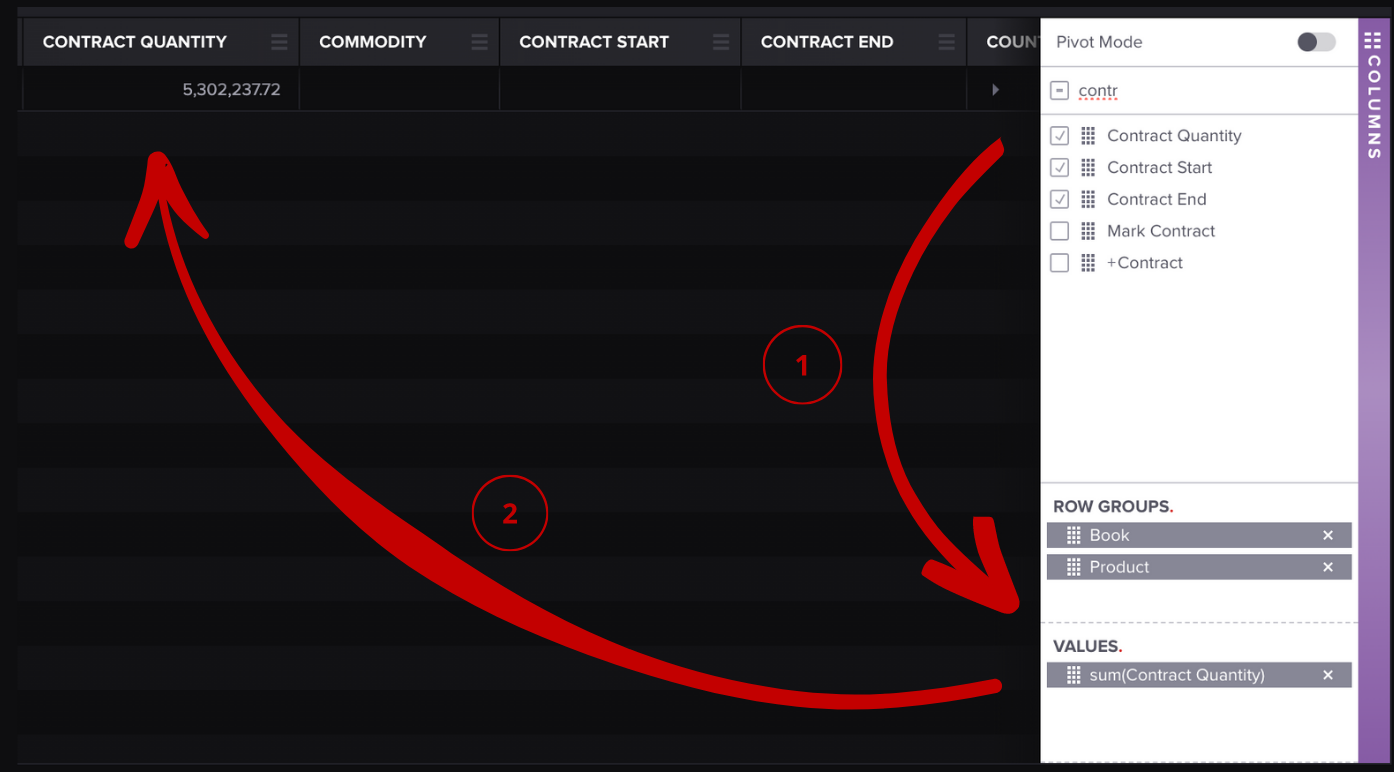
As you drag the items, columns will be added to your table in Molecule.
TIP: If columns aren't appearing in the table, make sure the column check box is clicked on the column picker.
The default aggregation method is a summation. If you'd like to change the aggregation, click on the item in the column picker, i.e. sum(Contract Quantity).
A list should auto-populate, as shown below:
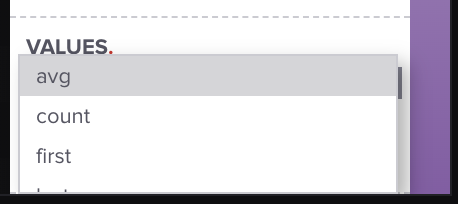
You can scroll and choose your desired aggregation method.
Pivot Mode
To pivot, toggle on Pivot Mode at the top of the column picture.
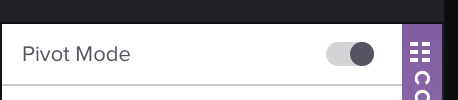
This COLUMN LABELS field should populate at the bottom of the column picker.

Once you've dragged your column label, it should populate at the top of your table, as shown below:
That's it! We hope this will save you some time. If you have any questions, please let us know at support@molecule.io.
See related: How to use the Valuations Screen.